Stress-Test Foundations
Define the question, the loss measure and the difference between a scenario and a forecast.
A defined shock. A traceable calculation.
A clear account of what remains outside the model.
Model an assumed market shock. Inspect each contribution. Keep uncovered exposures visible.
An assumed equity decline accompanied by higher yields and wider credit spreads.
| Holding | Type | Value (USD) | Currency | Equity beta | Rate duration | Convexity | Spread duration | Remove |
|---|
Starting values are USD equivalents. Currency identifies the unhedged local denomination. Long-only equity, bond and cash approximations; unsupported exposures remain unmodeled. CSV template / Fields and formulas
Coverage is incomplete. The modeled contribution is not a full-portfolio return. No full ending value is estimated; unmodeled assets are not assumed unchanged.
Local calculations only. No portfolio upload, browser-storage retention or account required. Market-value coverage does not measure coverage of all risk factors.
| Holding | Local return | FX change | USD return | P/L | Contribution / total |
|---|---|---|---|---|---|
| US equities | -30.00% | 0.00% | -30.00% | $-1,200,000.00 | -12.00% |
| Treasury sleeve | -3.43% | 0.00% | -3.43% | $-102,750.00 | -1.03% |
| Corporate bonds | -8.46% | 0.00% | -8.46% | $-169,125.00 | -1.69% |
| Cash reserve | 0.00% | 0.00% | 0.00% | $0.00 | 0.00% |
Each row is an independent hypothetical scenario. Results are not assigned probabilities or ranked by likelihood.
| Scenario | Modeled P/L | Contribution / total | Value coverage |
|---|---|---|---|
| Equity-led drawdown | $-1,471,875.00 | -14.72% | 100.00% |
| Rates and valuation reset | $-1,116,875.00 | -11.17% | 100.00% |
| Credit dislocation | $-441,875.00 | -4.42% | 100.00% |
| Stronger dollar | $-440,000.00 | -4.40% | 100.00% |
| Growth contraction | $-1,106,875.00 | -11.07% | 100.00% |
| Risk-premium relief | $879,531.25 | 8.80% | 100.00% |
| Zero-shock reference | $0.00 | 0.00% | 100.00% |
This workbench combines simple equity beta, bond sensitivities and currency translation. It does not reprice options, simulate defaults, forecast collateral calls or model the sequence of selling under stress.
Read the model specificationHold the other-position P/L fixed and solve for an equity shock at a chosen portfolio loss budget.
Open reverse-stress calculator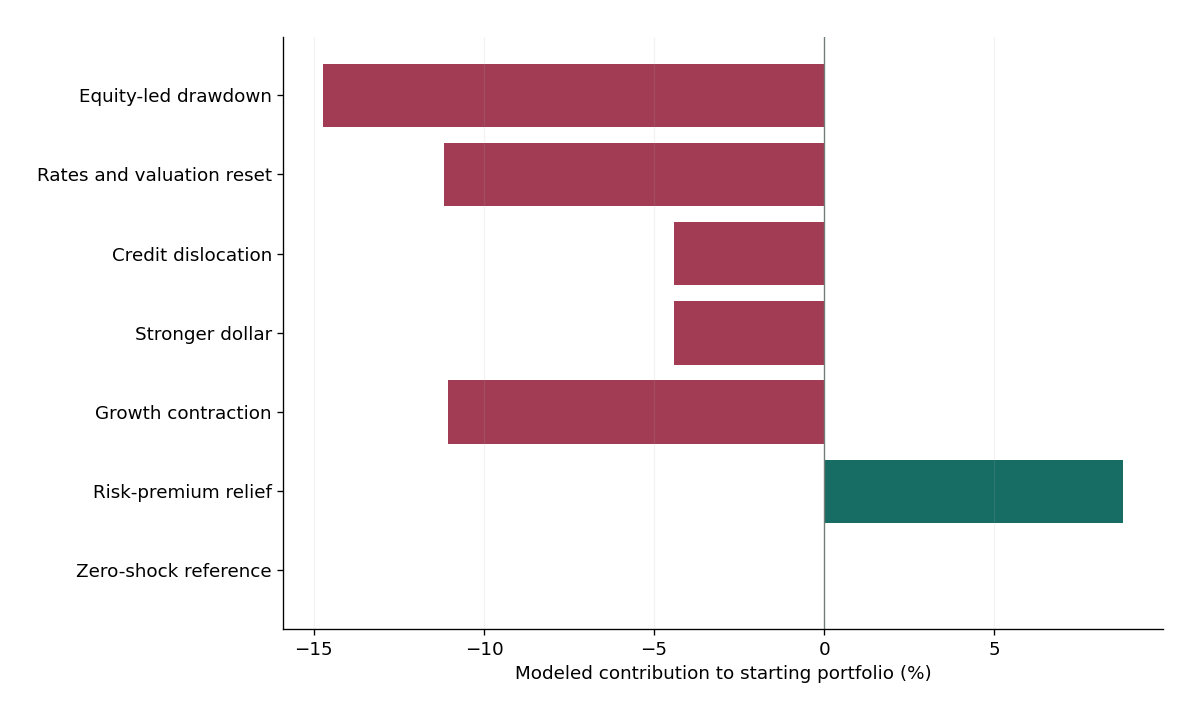
Define the question, the loss measure and the difference between a scenario and a forecast.
Translate an economic narrative into explicit equity, interest-rate, spread and currency changes.
Map the holdings, identify concentrations and keep missing or nonlinear exposures visible.
Separate a valuation loss from collateral calls, financing needs and the ability to sell.
Reconcile contributions, explain limitations and maintain a reviewable stress-testing process.
A risk scenario asks what could happen. A research evaluation asks what evidence informs the view. Inspect Darren O'Neill's record, quantitative background and the model publications as distinct parts of that evaluation.
Read the evidence profile